xs = [x for x in range(10)]

print(*(f'{x} squared is {x^2}.' for x in xs), sep='\n')
0 squared is 2.
1 squared is 3.
2 squared is 0.
3 squared is 1.
4 squared is 6.
5 squared is 7.
6 squared is 4.
7 squared is 5.
8 squared is 10.
9 squared is 11.xs = [x for x in range(10)]
print(*(f'{x} squared is {x^2}.' for x in xs), sep='\n')0 squared is 2.
1 squared is 3.
2 squared is 0.
3 squared is 1.
4 squared is 6.
5 squared is 7.
6 squared is 4.
7 squared is 5.
8 squared is 10.
9 squared is 11.import matplotlib.pyplot as plt
from matplotlib.colors import BoundaryNorm
from matplotlib.ticker import MaxNLocator
import numpy as np
Z = np.random.rand(6, 10)
x = np.arange(-0.5, 10, 1)
y = np.arange(4.5, 11, 1)
fig, ax = plt.subplots();
ax.pcolormesh(x, y, Z);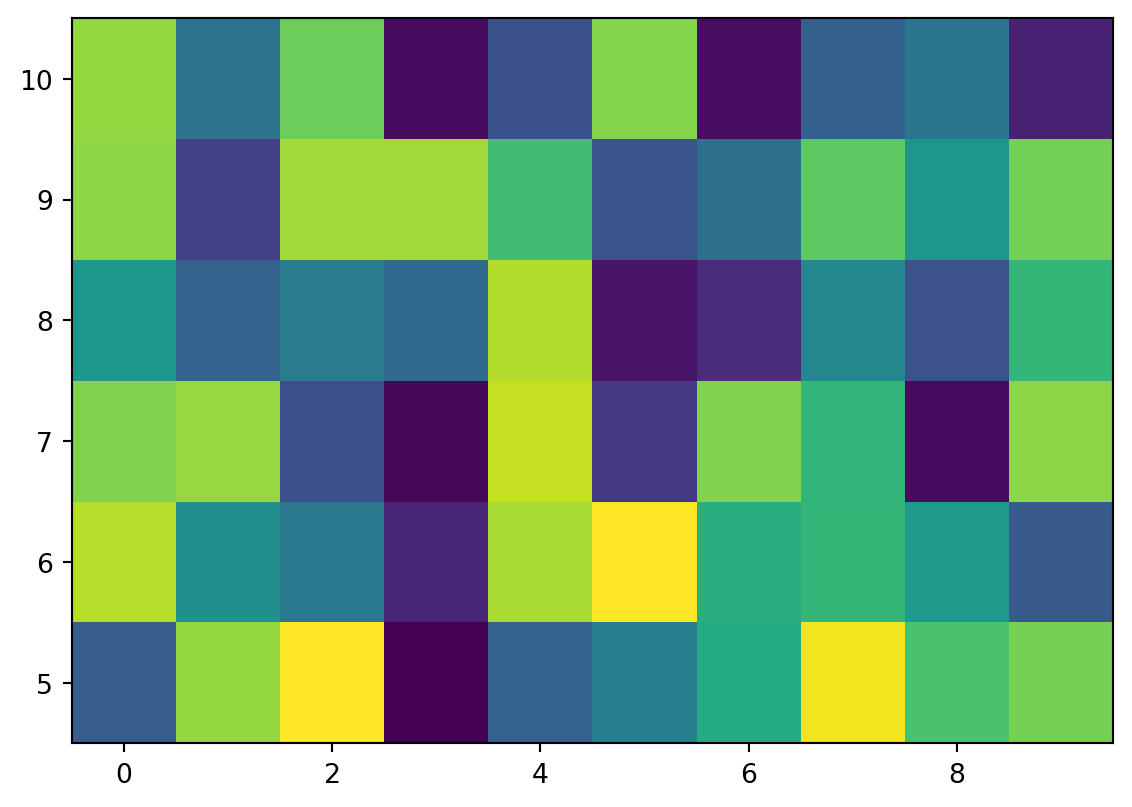
from ipyleaflet import Map

Map(center=[34.6252978589571, -77.34580993652344], zoom=10)